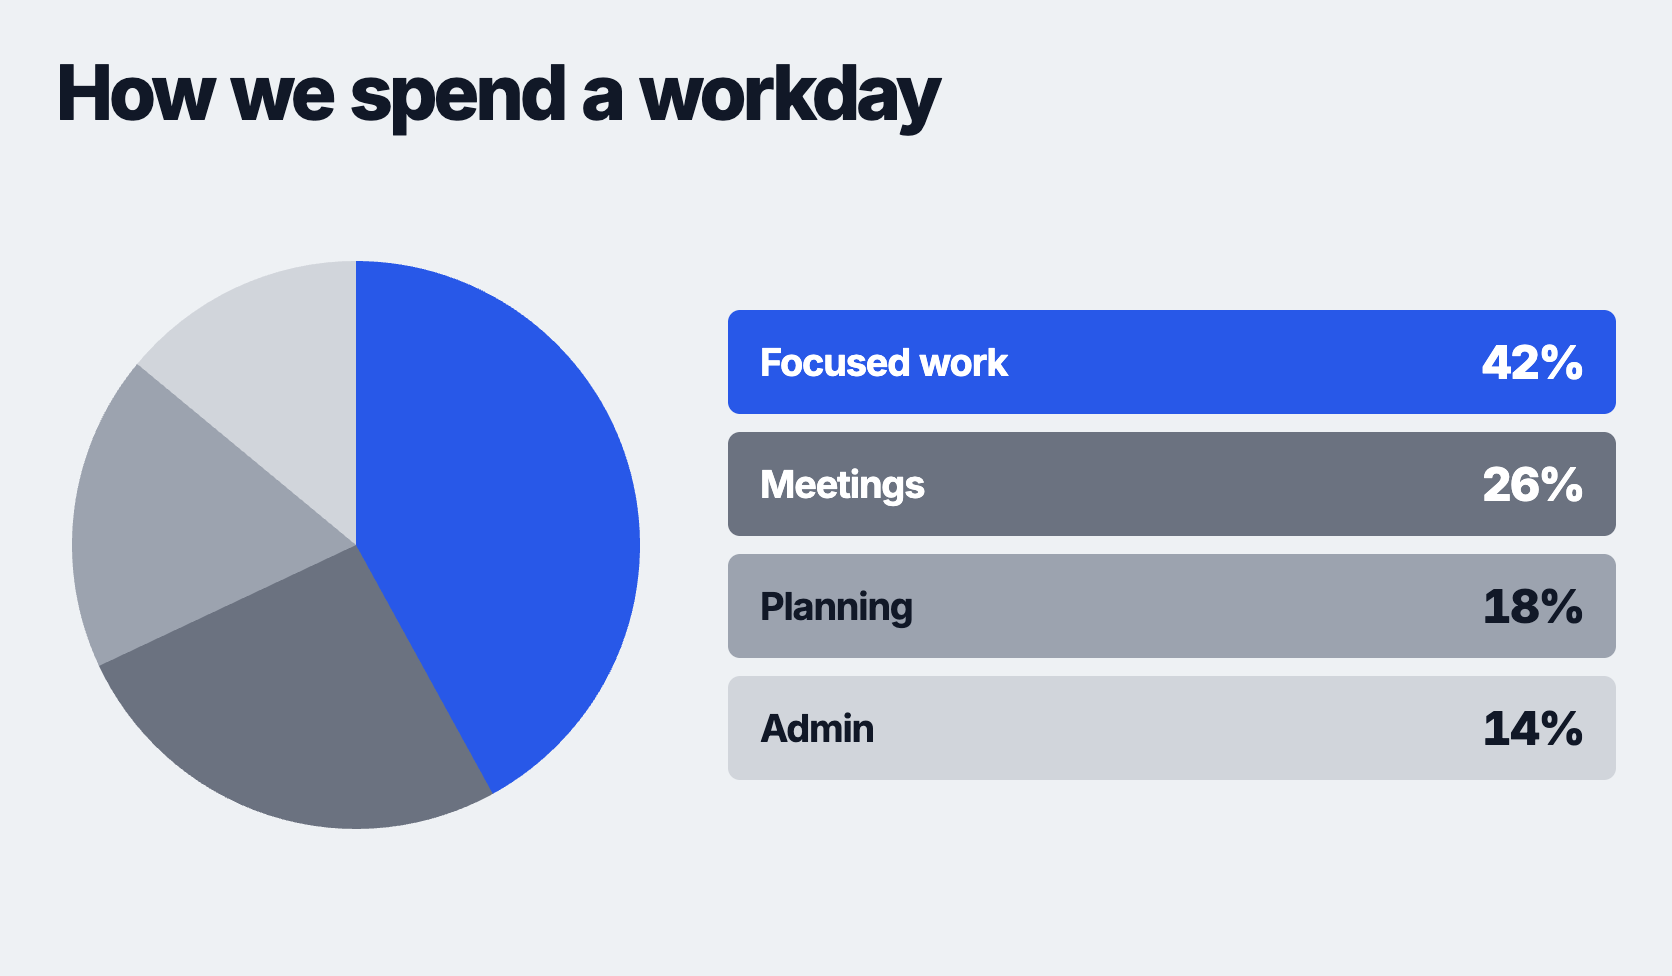
pie-chart.tsx
import {loadFont} from '@remotion/google-fonts/Inter';
import React from 'react';
import {Easing, Interactive, interpolate, useCurrentFrame} from 'remotion';
const {fontFamily} = loadFont('normal', {
subsets: ['latin'],
weights: ['700', '800'],
});
const data = [
{
color: '#2563eb',
foreground: '#ffffff',
label: 'Focused work',
value: 42,
},
{
color: '#6b7280',
foreground: '#ffffff',
label: 'Meetings',
value: 26,
},
{
color: '#9ca3af',
foreground: '#111827',
label: 'Planning',
value: 18,
},
{
color: '#d1d5db',
foreground: '#111827',
label: 'Admin',
value: 14,
},
];
const total = data.reduce((sum, item) => sum + item.value, 0);
const getPieSlicePath = ({
center,
endAngle,
radius,
startAngle,
}: {
readonly center: number;
readonly endAngle: number;
readonly radius: number;
readonly startAngle: number;
}) => {
if (endAngle <= startAngle) {
return `M ${center} ${center}`;
}
const startRadians = ((startAngle - 90) * Math.PI) / 180;
const endRadians = ((endAngle - 90) * Math.PI) / 180;
const startX = center + radius * Math.cos(startRadians);
const startY = center + radius * Math.sin(startRadians);
const endX = center + radius * Math.cos(endRadians);
const endY = center + radius * Math.sin(endRadians);
const largeArcFlag = endAngle - startAngle > 180 ? 1 : 0;
return [
`M ${center} ${center}`,
`L ${startX} ${startY}`,
`A ${radius} ${radius} 0 ${largeArcFlag} 1 ${endX} ${endY}`,
'Z',
].join(' ');
};
const LegendItem: React.FC<{
readonly color: string;
readonly foreground: string;
readonly label: string;
readonly value: number;
}> = ({color, foreground, label, value}) => {
const frame = useCurrentFrame();
return (
<Interactive.Div
name={`${label} legend item`}
cropLeft={interpolate(frame, [0, 44], [1, 0], {
easing: Easing.inOut(Easing.cubic),
extrapolateLeft: 'clamp',
extrapolateRight: 'clamp',
})}
style={{
alignItems: 'center',
backgroundColor: color,
borderRadius: 12,
boxSizing: 'border-box',
color: foreground,
display: 'flex',
height: 104,
justifyContent: 'space-between',
padding: '0 32px',
width: '100%',
}}
>
<Interactive.Div
name={`${label} label`}
style={{
fontSize: 38,
fontWeight: 700,
letterSpacing: -1.2,
lineHeight: 1,
opacity: interpolate(frame, [32, 44], [0, 1], {
easing: Easing.inOut(Easing.cubic),
extrapolateLeft: 'clamp',
extrapolateRight: 'clamp',
}),
whiteSpace: 'nowrap',
}}
>
{label}
</Interactive.Div>
<Interactive.Div
name={`${label} value`}
style={{
fontSize: 46,
fontWeight: 800,
letterSpacing: -1.6,
lineHeight: 1,
opacity: interpolate(frame, [6, 18], [0, 1], {
easing: Easing.inOut(Easing.cubic),
extrapolateLeft: 'clamp',
extrapolateRight: 'clamp',
}),
whiteSpace: 'nowrap',
}}
>
{value}%
</Interactive.Div>
</Interactive.Div>
);
};
export const PieChart: React.FC = () => {
const frame = useCurrentFrame();
const revealAngle = interpolate(frame, [8, 60], [0, 360], {
easing: Easing.inOut(Easing.cubic),
extrapolateLeft: 'clamp',
extrapolateRight: 'clamp',
});
let angle = 0;
return (
<Interactive.Div
name="Background"
style={{
alignItems: 'center',
backgroundColor: '#f5f6f7',
boxSizing: 'border-box',
display: 'flex',
height: '100%',
justifyContent: 'center',
padding: 56,
width: '100%',
}}
>
<Interactive.Div
name="Chart"
style={{
display: 'flex',
flexDirection: 'column',
fontFamily,
fontVariantNumeric: 'tabular-nums',
height: '100%',
justifyContent: 'center',
width: '100%',
}}
>
<div
style={{
alignItems: 'center',
display: 'flex',
flex: 1,
gap: 72,
minHeight: 0,
}}
>
<Interactive.Svg
name="Pie chart"
viewBox="0 0 600 600"
style={{
flex: '0 0 680px',
height: 680,
overflow: 'visible',
scale: interpolate(frame, [8, 40], [0.96, 1], {
easing: Easing.inOut(Easing.cubic),
extrapolateLeft: 'clamp',
extrapolateRight: 'clamp',
output: 'perceptual-scale',
}),
width: 680,
}}
>
<Interactive.Circle
name="Chart background"
cx={300}
cy={300}
fill="#e5e7eb"
opacity={interpolate(frame, [0, 8], [0, 1], {
easing: Easing.inOut(Easing.cubic),
extrapolateLeft: 'clamp',
extrapolateRight: 'clamp',
})}
r={284}
/>
{data.map(({color, label, value}) => {
const startAngle = angle;
const endAngle = angle + (value / total) * 360;
angle = endAngle;
return (
<Interactive.Path
key={label}
name={`${label} slice`}
d={getPieSlicePath({
center: 300,
endAngle: Math.min(endAngle, revealAngle),
radius: 284,
startAngle,
})}
fill={color}
/>
);
})}
</Interactive.Svg>
<div
style={{
display: 'flex',
flex: 1,
flexDirection: 'column',
gap: 18,
justifyContent: 'center',
}}
>
{data.map(({color, foreground, label, value}) => (
<Interactive.Div key={label} from={8} showInTimeline={false}>
<LegendItem
color={color}
foreground={foreground}
label={label}
value={value}
/>
</Interactive.Div>
))}
</div>
</div>
</Interactive.Div>
</Interactive.Div>
);
};