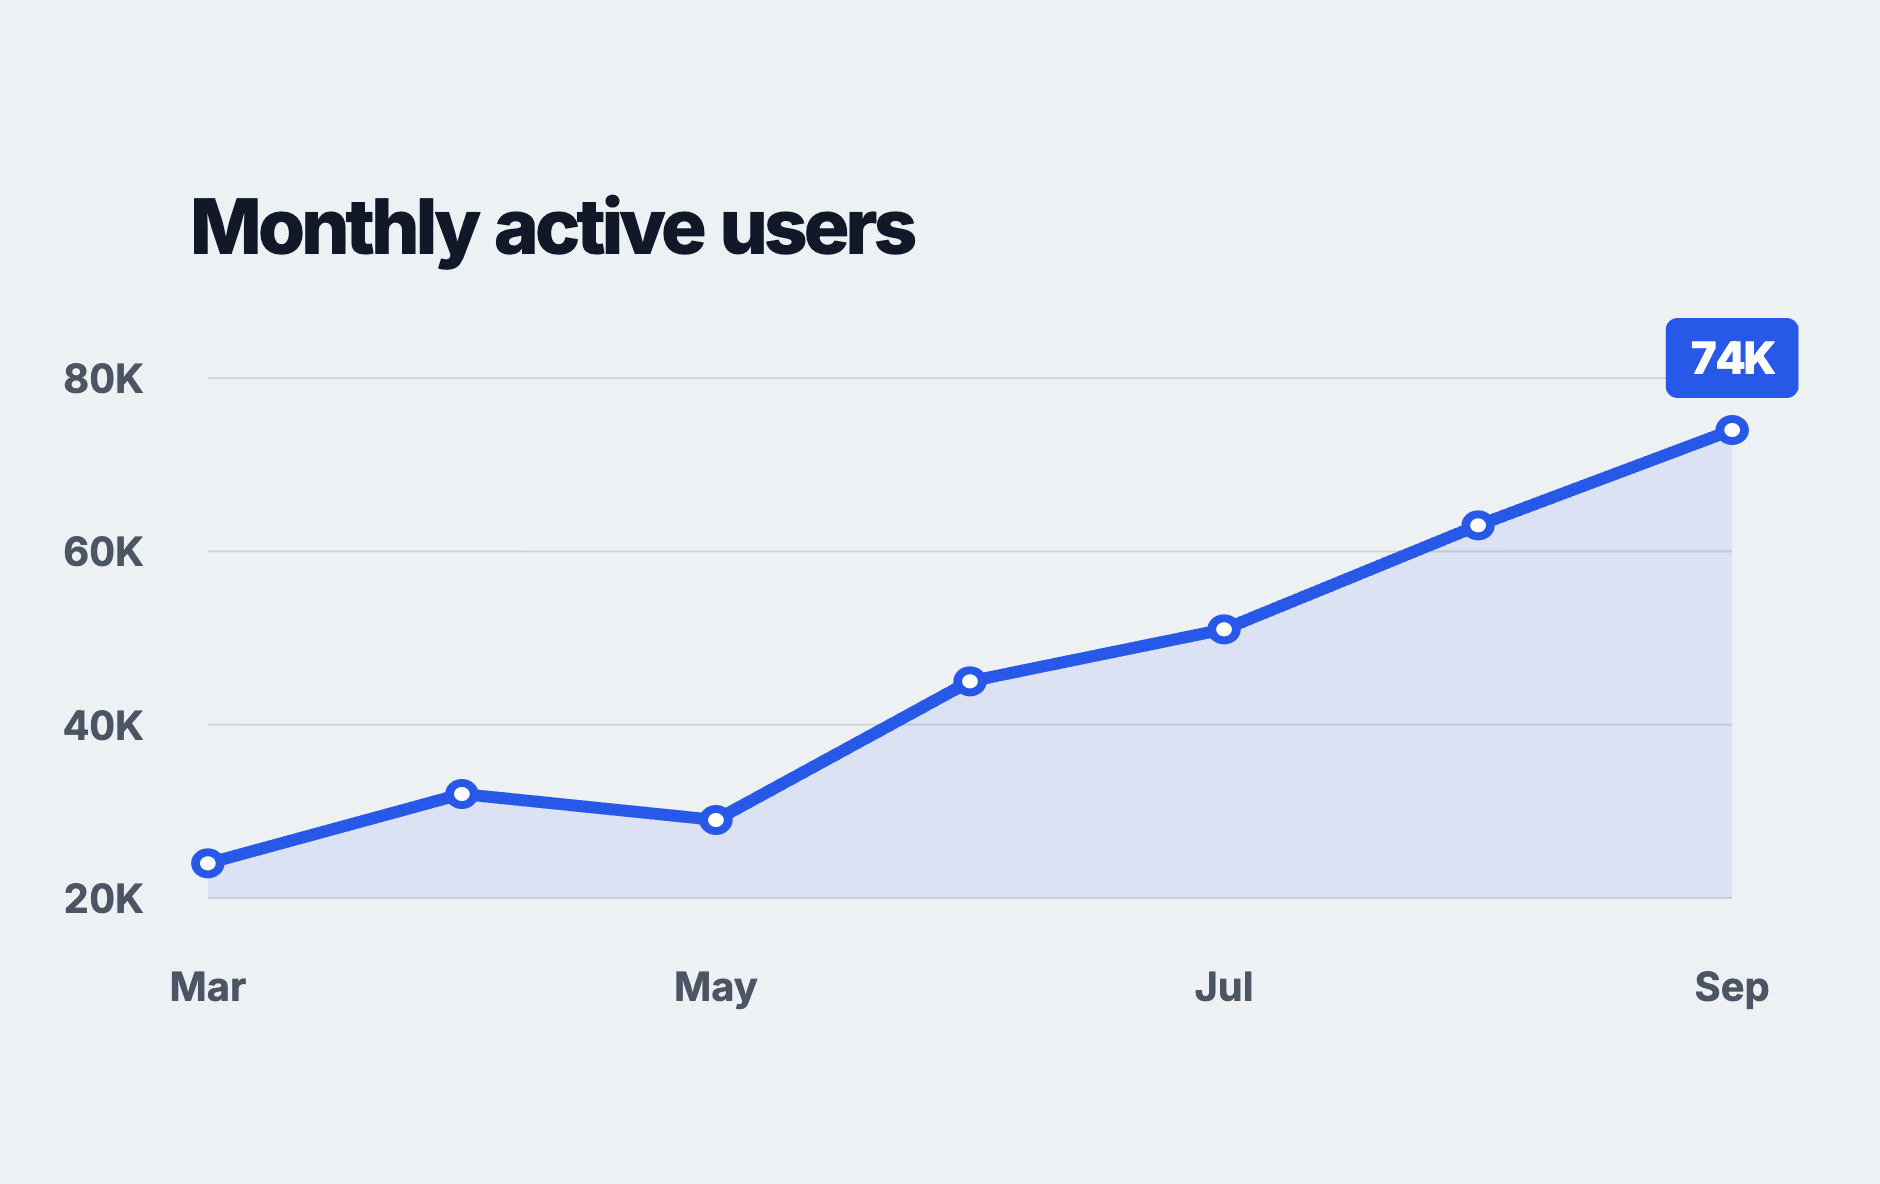
line-chart.tsx
import {loadFont} from '@remotion/google-fonts/Inter';
import React from 'react';
import {Easing, Interactive, interpolate, useCurrentFrame} from 'remotion';
const {fontFamily} = loadFont('normal', {
subsets: ['latin'],
weights: ['700', '800'],
});
const data = [
{label: 'Mar', value: 24},
{label: 'Apr', value: 32},
{label: 'May', value: 29},
{label: 'Jun', value: 45},
{label: 'Jul', value: 51},
{label: 'Aug', value: 63},
{label: 'Sep', value: 74},
];
const CHART_WIDTH = 1600;
const CHART_HEIGHT = 640;
const CHART_SIDE_PADDING = 16;
const MIN_VALUE = 20;
const MAX_VALUE = 80;
const Y_AXIS_VALUES = [80, 60, 40, 20];
const springEasing = Easing.spring({
damping: 14.5,
mass: 0.8,
overshootClamping: false,
stiffness: 100,
});
export const LineChart: React.FC = () => {
const frame = useCurrentFrame();
const latestValueProgress =
frame >= 70
? 1
: interpolate(frame, [58, 70], [0, 1], {
easing: springEasing,
extrapolateLeft: 'clamp',
extrapolateRight: 'clamp',
});
const points = data.map(({label, value}, index) => ({
label,
value,
x:
CHART_SIDE_PADDING +
(index / (data.length - 1)) * (CHART_WIDTH - CHART_SIDE_PADDING * 2),
y: ((MAX_VALUE - value) / (MAX_VALUE - MIN_VALUE)) * CHART_HEIGHT,
}));
const linePath = points.reduce((path, {x, y}, index) => {
if (index === 0) {
return `M ${x} ${y}`;
}
return `${path} L ${x} ${y}`;
}, '');
const latestPoint = points[points.length - 1];
return (
<Interactive.Div
name="Background"
style={{
alignItems: 'center',
backgroundColor: '#f5f6f7',
boxSizing: 'border-box',
display: 'flex',
height: '100%',
justifyContent: 'center',
padding: 160,
width: '100%',
}}
>
<Interactive.Div
name="Chart"
style={{
color: '#111827',
display: 'flex',
flexDirection: 'column',
fontFamily,
fontVariantNumeric: 'tabular-nums',
height: '100%',
justifyContent: 'center',
width: '100%',
}}
>
<Interactive.Div
name="Plot area"
style={{
height: CHART_HEIGHT,
marginBottom: 64,
position: 'relative',
}}
>
<svg
viewBox={`0 0 ${CHART_WIDTH} ${CHART_HEIGHT}`}
preserveAspectRatio="none"
style={{
height: '100%',
overflow: 'visible',
position: 'absolute',
width: '100%',
}}
>
<Interactive.G
name="Grid lines"
fill="none"
stroke="#d1d5db"
strokeWidth={2}
>
{Y_AXIS_VALUES.map((value) => {
const y =
((MAX_VALUE - value) / (MAX_VALUE - MIN_VALUE)) *
CHART_HEIGHT;
return (
<line
key={value}
x1={CHART_SIDE_PADDING}
x2={CHART_WIDTH - CHART_SIDE_PADDING}
y1={y}
y2={y}
/>
);
})}
</Interactive.G>
<Interactive.Path
name="Trend line"
d={linePath}
fill="none"
pathLength={1}
stroke="#2563eb"
strokeDasharray="1 1"
strokeDashoffset={interpolate(frame, [14, 58], [1, 0], {
easing: Easing.bezier(0, 0, 0.58, 1),
extrapolateLeft: 'clamp',
extrapolateRight: 'clamp',
})}
strokeLinecap="round"
strokeLinejoin="round"
strokeWidth={12}
/>
<Interactive.G
name="Data points"
fill="#ffffff"
stroke="#2563eb"
strokeWidth={8}
>
{points.map(({label, x, y}, index) => (
<circle
key={label}
cx={x}
cy={y}
r={interpolate(
frame,
[
index === 0 ? 7 : 14 + index * 7,
index === 0 ? 15 : 22 + index * 7,
],
[0, 11],
{
easing: Easing.bezier(0.34, 1.56, 0.64, 1),
extrapolateLeft: 'clamp',
extrapolateRight: 'clamp',
},
)}
/>
))}
</Interactive.G>
</svg>
<div
style={{
color: '#4b5563',
fontSize: 40,
fontWeight: 700,
height: 48,
left: 0,
position: 'absolute',
right: 0,
top: 'calc(100% + 64px)',
}}
>
{data.map(({label}, index) =>
index % 2 === 0 ? (
<div
key={label}
style={{
left: `${((CHART_SIDE_PADDING + (index / (data.length - 1)) * (CHART_WIDTH - CHART_SIDE_PADDING * 2)) / CHART_WIDTH) * 100}%`,
position: 'absolute',
top: 0,
transform: 'translateX(-50%)',
}}
>
<Interactive.Div
name="X-axis label"
style={{translate: '0px 0px'}}
>
{label}
</Interactive.Div>
</div>
) : null,
)}
</div>
<div
style={{
left: `${(latestPoint.x / CHART_WIDTH) * 100}%`,
position: 'absolute',
top: `${(latestPoint.y / CHART_HEIGHT) * 100}%`,
translate: '-50% -140%',
}}
>
<Interactive.Div
name="Latest value"
style={{
backgroundColor: '#2563eb',
borderRadius: 12,
color: '#ffffff',
fontSize: 44,
fontWeight: 800,
lineHeight: 1,
padding: '18px 24px',
scale: `${latestValueProgress}`,
transformOrigin: 'bottom center',
visibility: frame <= 58 ? 'hidden' : 'visible',
whiteSpace: 'nowrap',
willChange: 'transform',
}}
>
{latestPoint.value}K
</Interactive.Div>
</div>
</Interactive.Div>
</Interactive.Div>
</Interactive.Div>
);
};